Backend Briefing: How do we know when the lights go out?
7th November 2022 | PTFS-Europe
Here at PTFS Europe, we look after over 200 separate servers, of which somewhere around 180 belong to customers. Each of those servers has its own service-level agreement (SLA) outlining our contractual obligations for uptime and minimum permitted response times from us in the Infrastructure team to a system outage.
So, how do we know when a system outage actually occurs?
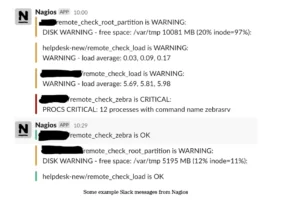
Historically, we used a system known as Nagios. Nagios is a monitoring suite, which uses a series of checks and balances to alert us to a system’s running health and ping us via email, and our work communication network, Slack.
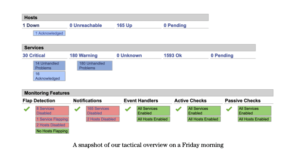
The Nagios system also presents a tactical overview, where we can see at a glance which hosts are troublesome and might be in need of some TLC.
Nagios has served PTFS Europe well since its inception in 2007, but we are now in a migratory phase to a new system: Zabbix.
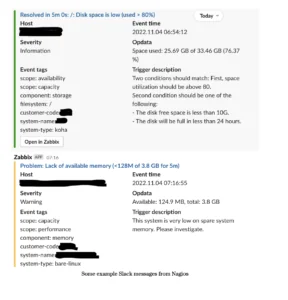
Zabbix fulfils the same mission statement as Nagios does: to provide real-time alerting of a fleet of servers. The key difference is that Zabbix is a modern, open-source solution that provides much richer detail to the Infrastructure team. For example, Slack messages contain contextual information:
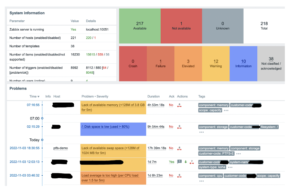
The Zabbix dashboard also shows a great deal more information to the team on current problems, as well as a visual tactical overview of the monitoring system and its agents (the tool that gets installed on our customer’s servers to provide us with the rich telematics).
Why is PTFS Europe switching monitoring systems after so long with Nagios?
In 2009, Nagios went closed-source. The open-source Nagios 4 software has continued to be maintained by a small team of software developers, but the suite is now bereft of modern features, and the plugins library is increasingly unreliable on newer versions of Linux (the operating system we use on our Koha and Aspen servers). Zabbix, by contrast, is a mature and constantly evolving suite of monitoring tools that are set to remain open-source for the foreseeable future.
The real benefit of our new monitoring system, however, is three:
- More accurate monitoring through the use of customisable but consistent service templates
- Faster alerting of emerging faults, which means possibly pre-emptive action in some cases (something Nagios was poor at)
- Vastly improved SLA tracking, so we can at last begin to consider implementing reporting on annual server uptimes
These three improvements will allow us to get better at looking after your servers, as well as provide invaluable new ways of predicting software and hardware changes that may need to be made for continued good performance and service.
As always, if you have any questions about PTFS Europe’s infrastructure, please feel free to raise a support ticket – one of our team will be happy to answer your questions!
If you enjoyed this post, check out our recent blog entry, ‘One from the archives: Scheduled Scripts and Reports’ by clicking here.